All articles
·
15 min read
How to Measure AI Visibility and Share of Voice in 2026
Measure AI visibility the right way with mention rate, share of voice, and a simple score.

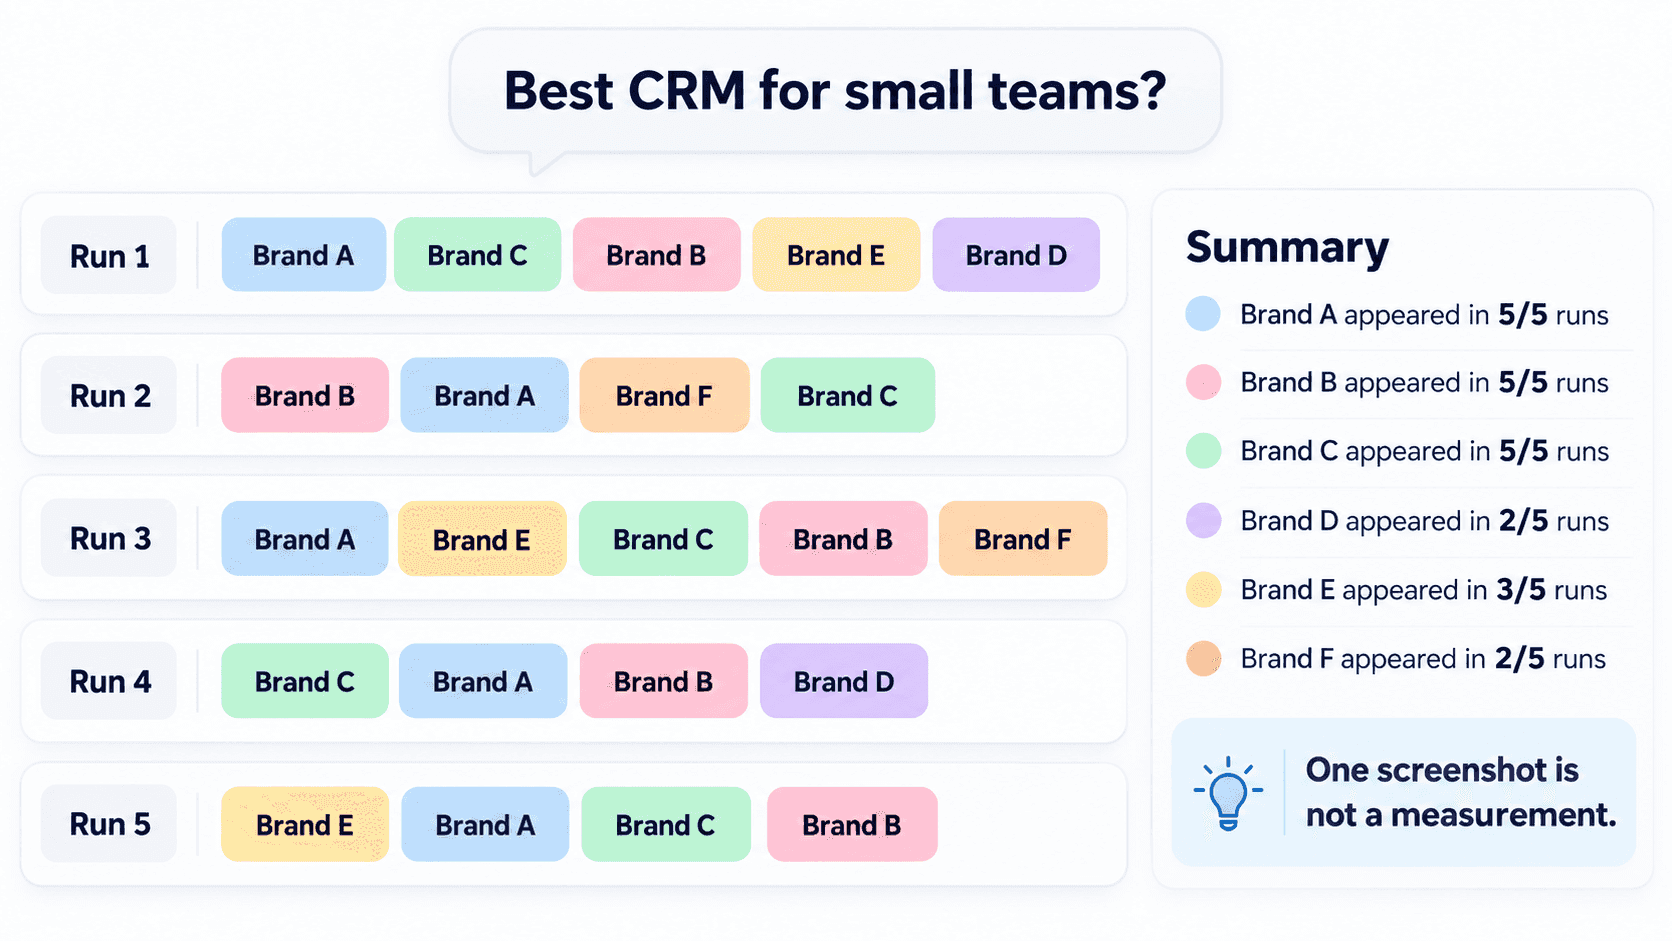
Most teams start measuring AI visibility the same way: someone asks ChatGPT about the category, takes a screenshot, and shares it in Slack. It feels like data, but it is a single sample from a system that gives a different answer almost every time you ask.
Measuring AI visibility properly means treating it as a rate, not a snapshot.
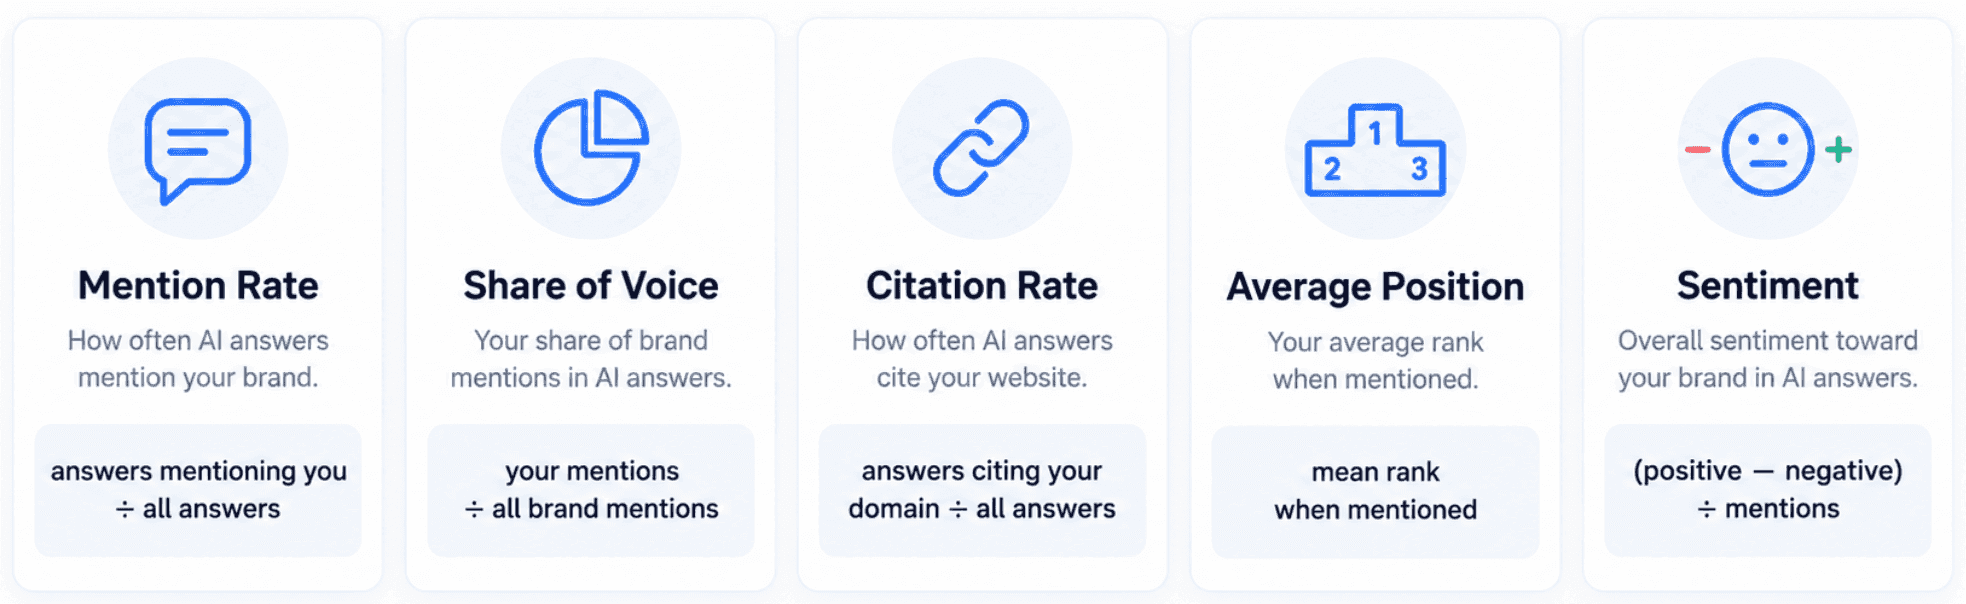
The short answer: to measure AI visibility, run a fixed set of buyer prompts across the AI platforms your customers use, repeat each prompt many times, and track five numbers over time:
Mention rate. The share of AI answers that name your brand.
Share of voice. Your mentions as a share of all brand mentions in your category.
Citation rate. The share of answers that link to your website as a source.
Average position. Where your brand appears among the brands an answer names.
Sentiment. Whether the answer describes your brand positively, neutrally, or negatively.
Add first-party data from Google Search Console and Bing Webmaster Tools on top, and you have a measurement system you can report on with confidence. This guide explains how to calculate each metric, how to combine them into an AI visibility score, and how to report the results without overstating what the data shows.
What Does Measuring AI Visibility Actually Mean?
AI visibility is how often and how prominently a brand appears in answers generated by AI systems such as ChatGPT, Claude, Gemini, Perplexity, and Google AI Overviews. Measuring it means estimating that presence across many answers, so you can see whether it is growing, shrinking, or stuck.
AI visibility measurement sits underneath both Generative Engine Optimization (GEO) and Answer Engine Optimization (AEO). GEO and AEO describe the work of earning a place in AI answers. Measurement tells you whether that work is paying off, and where to aim it next.
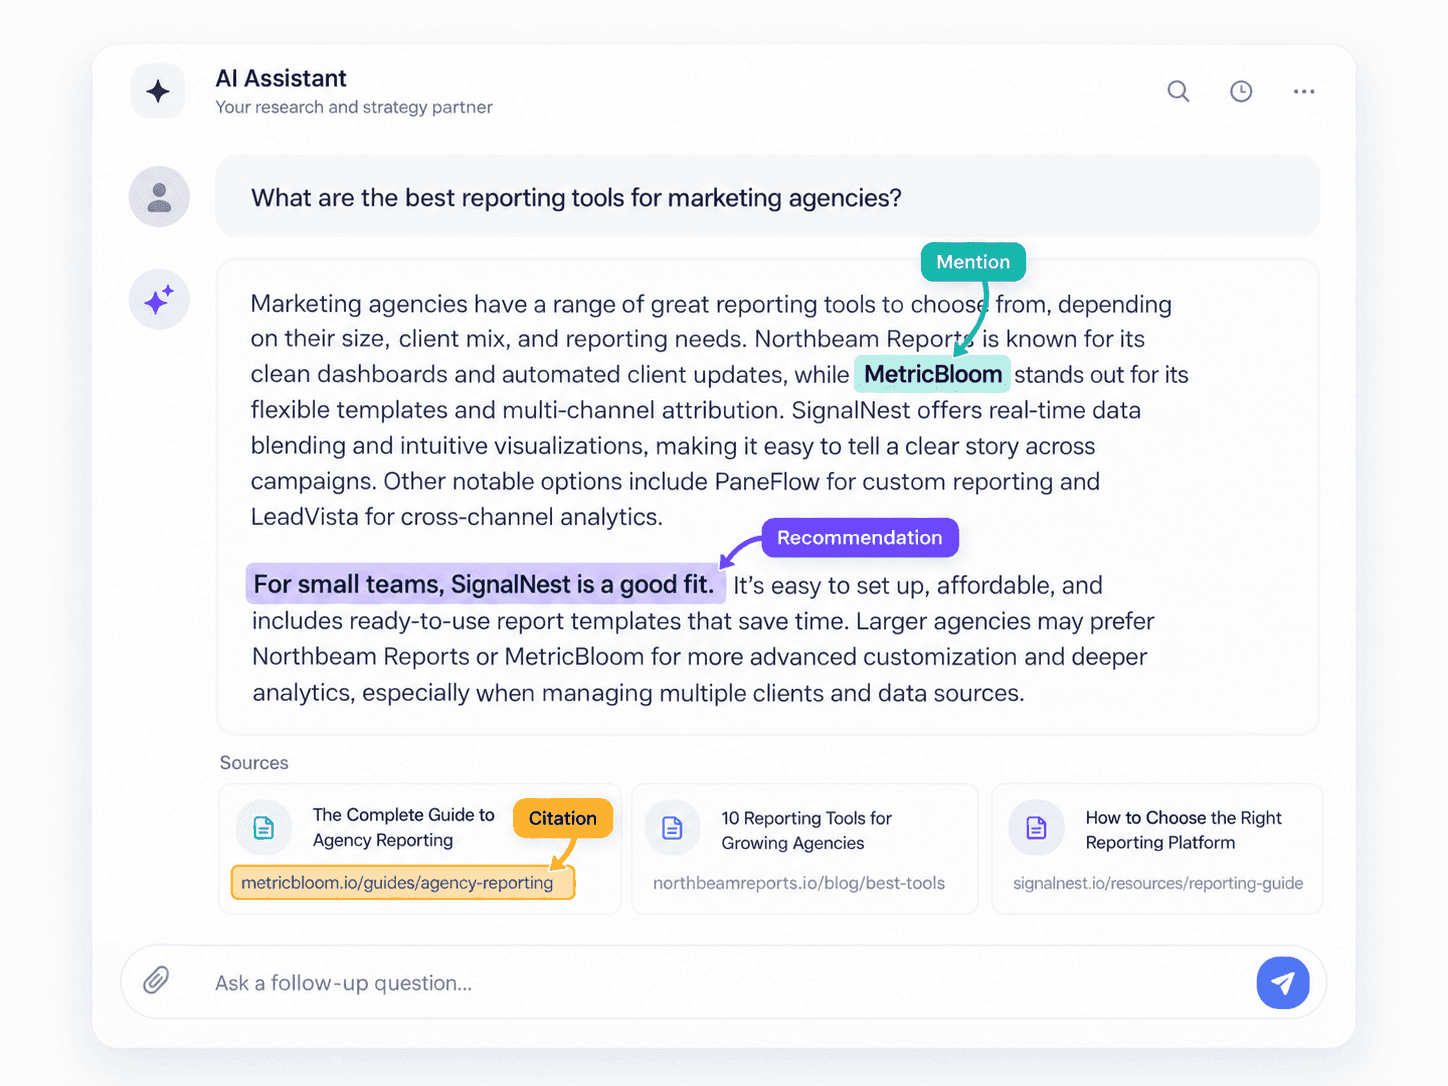
Mentions, Citations, and Recommendations Are Different Things
A single AI answer can include your brand in three different ways, and each one needs to be counted separately.
Type of presence | What it means | Example |
|---|---|---|
Mention | The answer names your brand in the text | “Tools like Visby and Peec AI track this” |
Citation | The answer links to a page on your domain as a source | Your pricing page appears in the source list |
Recommendation | The answer actively suggests your brand as a choice | “For small teams, Visby is a good fit” |
The three do not always move together. A brand can be cited for a definition without ever being recommended, or recommended because of third-party reviews without its own site being cited at all. A measurement setup that only counts one of them will give you a misleading picture.
Why AI Visibility Has to Be Measured as a Distribution?
AI answers change from one run to the next, even for an identical question. A 2026 study from the University of St. Gallen, Don’t Measure Once, tracked four AI search engines daily for about six weeks and concluded that single observations of AI visibility are misleading and can over- or underestimate a brand’s true presence. Summaries of the paper report that the set of brands mentioned for the same question overlapped by only about half from one day to the next, and the set of cited sources by even less.
The practical consequence is simple. One answer tells you what happened once. A rate across dozens of runs tells you what is likely to happen when your buyer asks. Visby’s own pilot work shows how much this varies by category: in our Category Temperature study, the leader in fuel retail held rank one in 95% of runs, while the insurance leader held it in only 49%.
Which AI Visibility Metrics Should You Track?
The core AI visibility metrics are mention rate, share of voice, citation rate, average position, and sentiment. Stability metrics and first-party data then tell you how much to trust the numbers and whether visibility turns into traffic.
Metric | How to calculate it | What it tells you |
|---|---|---|
Mention rate | Answers that name your brand ÷ all answers × 100 | How often the model associates you with the topic |
Share of voice | Your brand mentions ÷ mentions of all tracked brands × 100 | How prominent you are relative to competitors |
Citation rate | Answers that cite your domain ÷ all answers × 100 | Whether the model uses your content as a source |
Source share | Citations of your domain ÷ all citations × 100 | How much of the evidence base you own |
Average position | Mean rank of your brand among named brands, in answers that mention you | Whether you are the first suggestion or an afterthought |
Rank-one rate | Answers where you are named first ÷ answers that mention you × 100 | How often you are the default recommendation |
Sentiment score | (Positive mentions − negative mentions) ÷ all mentions | Whether visibility helps or hurts consideration |
Mention Rate Is the Foundation
Mention rate is the share of AI answers to your tracked prompts that name your brand at least once. If a brand appears in 12 of 40 answers, its mention rate is 30%. Every other brand metric depends on it, because you cannot have a position, sentiment, or recommendation in an answer that does not mention you.
Count a brand once per answer, even if the answer names it several times. Otherwise long answers inflate the number.
Share of Voice Shows Your Competitive Position
Share of voice in AI search is your brand’s mentions as a percentage of all mentions across a defined competitor set. If, across 100 answers, your brand is mentioned 30 times and four competitors are mentioned 70 times in total, your share of voice is 30%.
Share of voice only means something relative to a fixed competitor list. Adding or removing a competitor changes everyone’s share, so lock the list before you start reporting, and note any change when it happens.
Citation Rate and Source Share Show Whether You Are Trusted
Citation rate measures how often an answer links to your domain. Source share measures what portion of all cited URLs are yours. A brand with a high mention rate but low citation rate is known but not used as evidence. The fix there is usually content and third-party coverage, not brand awareness.
It also helps to track which other domains are cited for your prompts. Those domains are often review sites, comparison articles, and community threads, and they show you where to earn coverage.
Position and Rank-One Rate Show How Strongly You Are Recommended
Average position is only calculated over answers that mention you. That is why it has to be read alongside mention rate. In Visby’s insurance pilot, one brand appeared in 57% of answers but held an average rank of 1.35, while another appeared in 79% of answers with an average rank of 2.46. The first brand wins fewer conversations but leads them when it appears. The second is everywhere but rarely first.
Stability Metrics Tell You How Much to Trust a Number
Two extra measures help separate real change from noise. Mention stability is the percentage of runs in which a brand appears, broken down by model, market, or funnel stage. Position variance shows how much a brand’s rank moves from run to run. Visby combines these with a concentration index into a Category Temperature score that shows whether a category is settled or still open to competitors.
First-Party Data Connects Visibility to Real Traffic
Tracked prompts are samples. First-party sources show what actually happened:
Google Search Console. The generative AI performance report, introduced in June 2026, shows impressions for your pages in AI Overviews and AI Mode.
Bing Webmaster Tools. The AI Performance report shows how often your site is cited in Copilot and Bing’s AI answers. We tested it with real data.
GA4 or your analytics tool. Referral sessions from AI platforms such as ChatGPT and Perplexity show whether visibility leads to visits.
How Do You Calculate an AI Visibility Score?
An AI visibility score is a single number, usually from 0 to 100, that combines several AI visibility metrics into one indicator. There is no industry standard formula, so every tool weights the inputs differently. What matters is choosing a formula you understand and keeping it fixed over time.
A simple, transparent version weights four inputs:
Input | Weight | How it is converted to a 0 to 100 value |
|---|---|---|
Mention rate | 40% | Used as is |
Position score | 20% | 100 ÷ average position (1st = 100, 2nd = 50, 3rd = 33) |
Citation rate | 20% | Used as is |
Sentiment | 20% | (Sentiment score + 1) ÷ 2 × 100 |
Mention rate gets the largest weight because it drives everything else. You can change the weights to fit your goals. A brand that depends on referral traffic might weight citation rate higher, for example. Just do not change them mid-quarter.
A Worked Example With Four Competing Brands
The numbers below are hypothetical and show how the calculation works. They are not customer data.
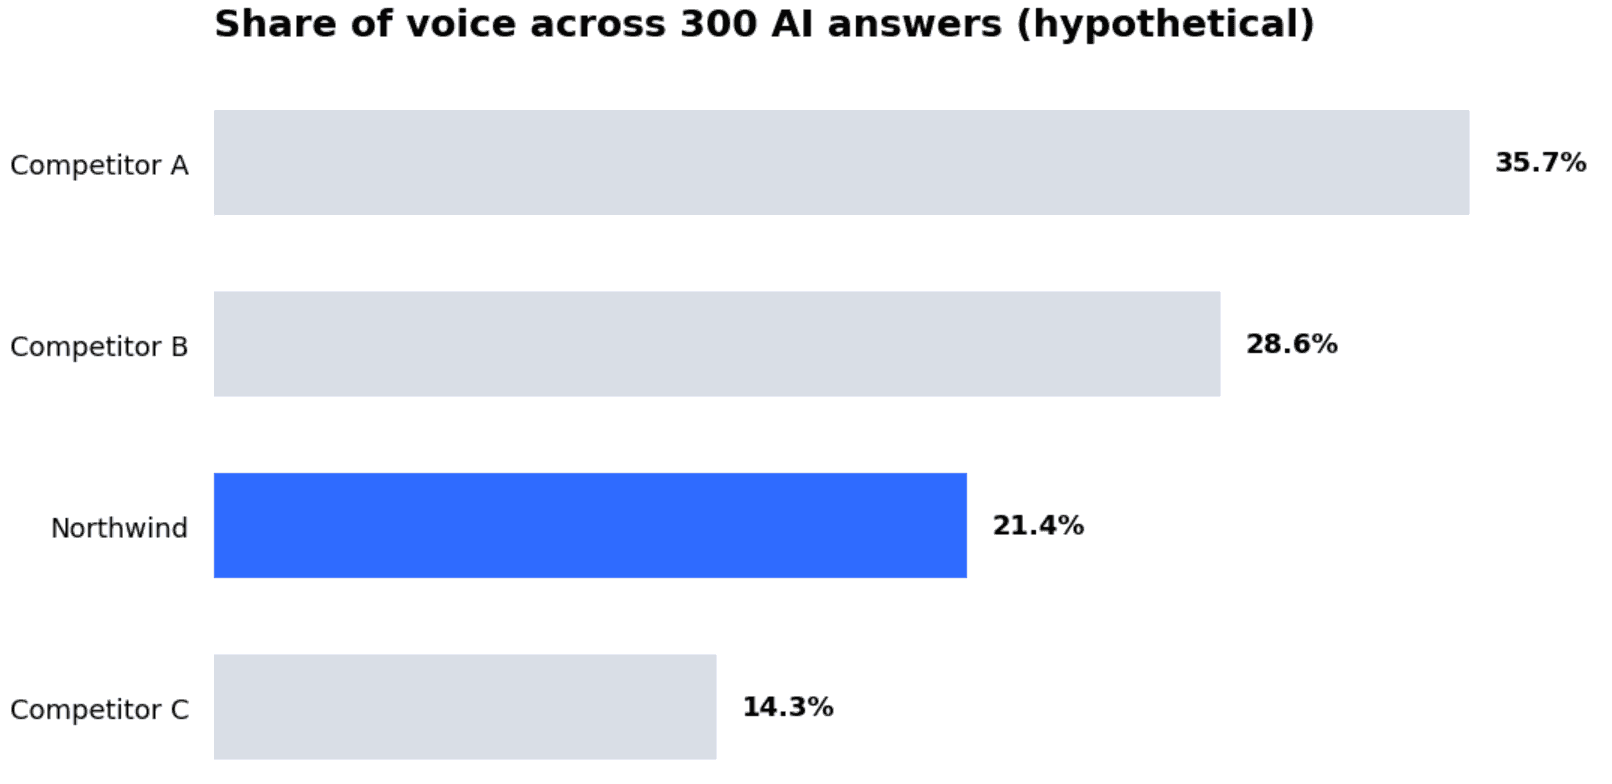
A project management brand, “Northwind,” tracks 20 prompts across ChatGPT, Claude, and Gemini, with each prompt run 5 times per model. That gives 300 answers. Northwind is compared against three competitors.
Brand | Answers mentioning the brand | Mention rate | Share of voice |
|---|---|---|---|
Competitor A | 150 | 50% | 35.7% |
Competitor B | 120 | 40% | 28.6% |
Northwind | 90 | 30% | 21.4% |
Competitor C | 60 | 20% | 14.3% |
Total | 420 mentions | 100% |
Share of voice is each brand’s mentions divided by the 420 total mentions. Northwind’s 90 mentions give it 21.4%.
Northwind’s other inputs are:
Citation rate: 36 of 300 answers cite Northwind’s domain, so 12%.
Average position: 2.5 when mentioned, so a position score of 100 ÷ 2.5 = 40.
Sentiment: 60 positive, 25 neutral, and 5 negative mentions give a sentiment score of (60 − 5) ÷ 90 = 0.61, which converts to 81.
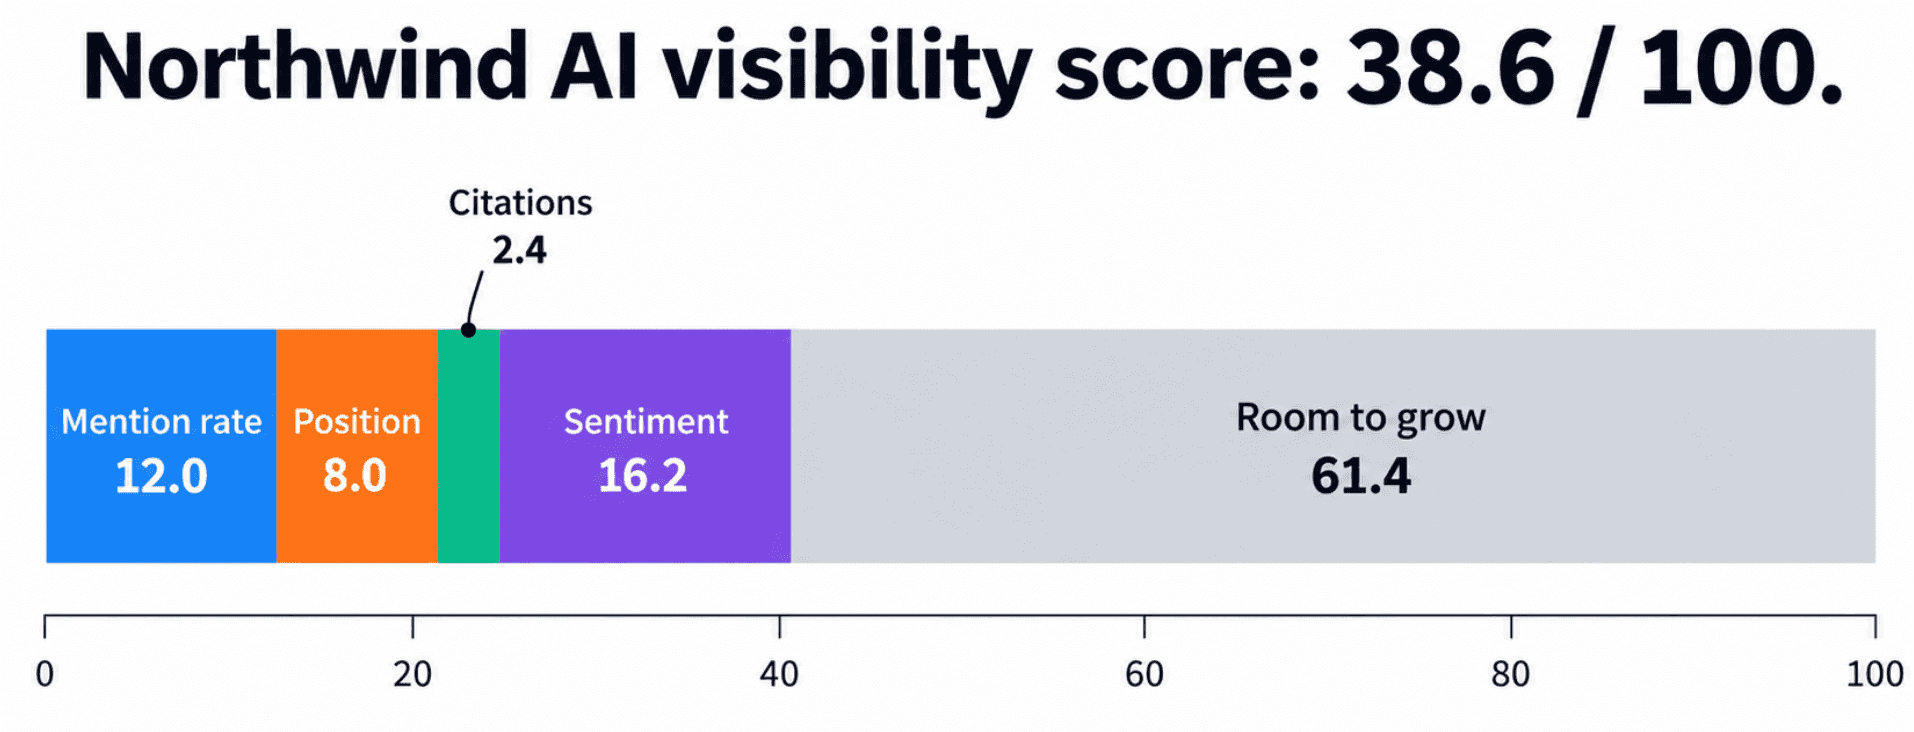
The AI visibility score is then (0.4 × 30) + (0.2 × 40) + (0.2 × 12) + (0.2 × 81) = 12 + 8 + 2.4 + 16.2 = 38.6 out of 100.
Break the Score Down Before You Act on It
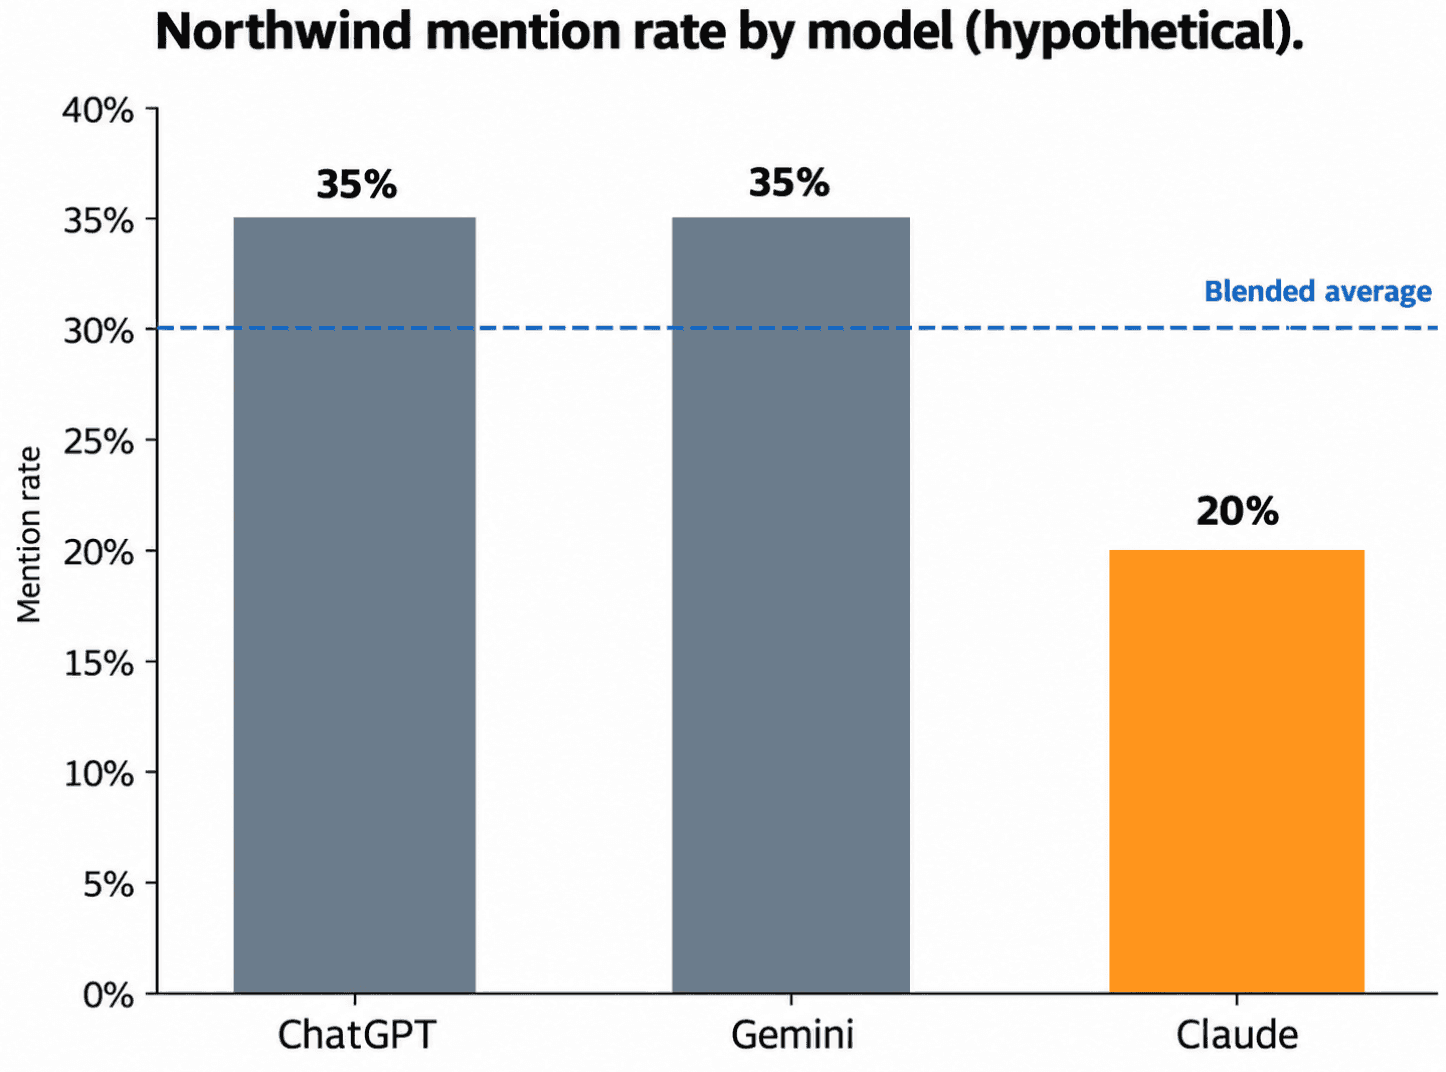
A blended score hides where the problem is. In the same example, splitting mention rate by model shows a clearer story:
Model | Northwind mention rate |
|---|---|
ChatGPT | 35% |
Gemini | 35% |
Claude | 20% |
The weak spot is Claude, not Northwind’s visibility in general. Splitting by funnel stage often reveals the same kind of gap, for example strong visibility on comparison prompts but almost none on early research prompts. Always report the score with at least one breakdown underneath it.
How to Set Up AI Visibility Measurement Step by Step?
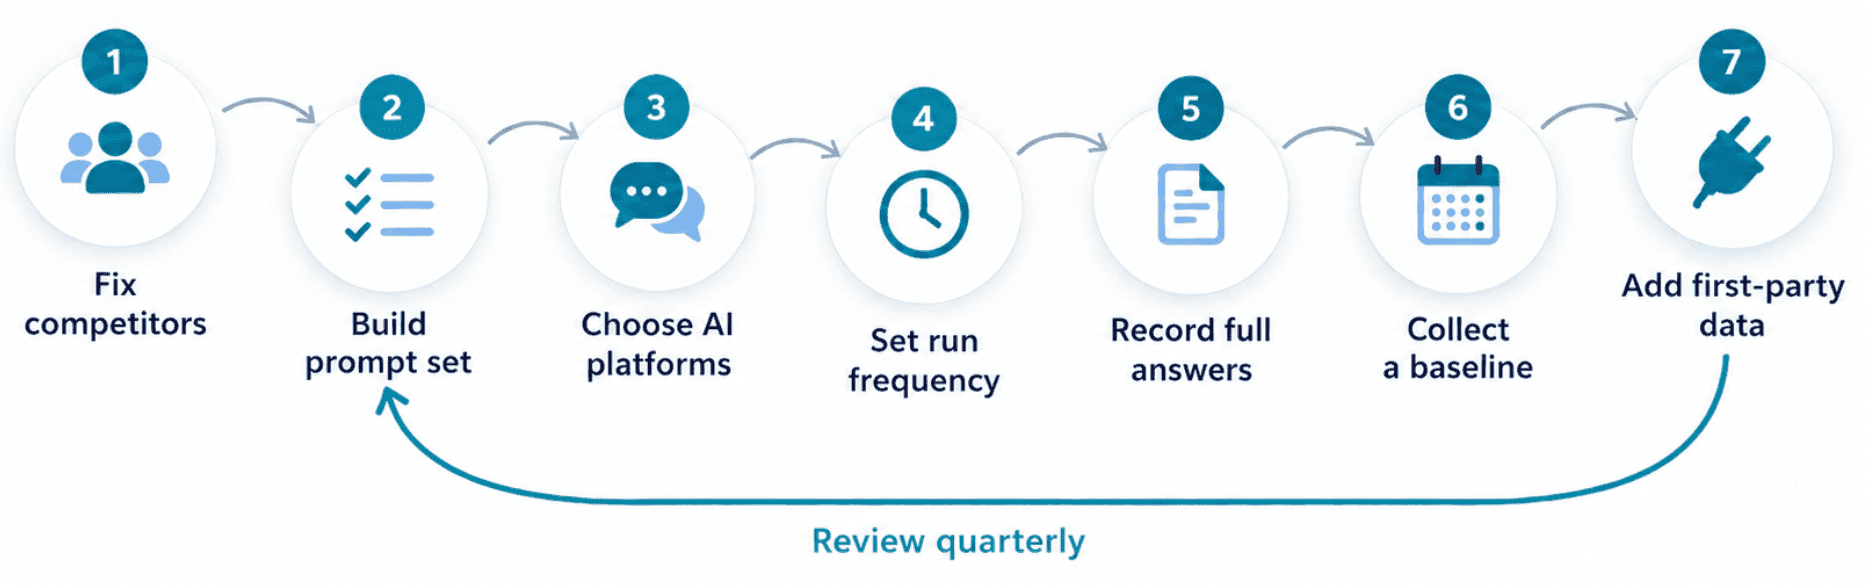
1. Fix Your Competitor Set
Choose three to six competitors your buyers actually compare you with. Share of voice depends entirely on this list, so agree on it with sales and marketing before you collect any data.
2. Build a Prompt Set Around the Buying Journey
Write 30 to 100 prompts that reflect real buyer questions, grouped by funnel stage:
Awareness. “How do small agencies manage client reporting?”
Consideration. “Best reporting tools for marketing agencies”
Decision. “Northwind vs Competitor A for agencies”
Keep branded prompts, the ones that name your brand, in a separate group. Branded prompts almost always mention you, so mixing them with unbranded prompts can make overall visibility look healthy while your brand is absent from the questions that bring in new buyers. If you need inspiration, our analysis of the AI search prompts brands monitor most shows common patterns.
3. Choose the AI Platforms Your Buyers Use
Track the models your customers rely on, not every model available. For many B2B brands that means ChatGPT and Claude first, with Gemini or Google AI Overviews added when search-driven discovery matters. Claude is often the hardest to cover affordably, and our roundup of options for monitoring Claude answers compares the tools. For Google’s AI surfaces specifically, see our guide to AI Overview and AI Mode trackers.
4. Decide How Often to Run Each Prompt
Run each prompt more than once per model, and on a regular schedule. Daily or weekly runs produce a usable mention rate after a few weeks. More runs per prompt narrow the range of uncertainty, which is why tools that sample frequently produce steadier trend lines.
Keep the location, language, and account settings consistent. Changing any of them changes the answers.
5. Record the Full Answer, Not Just a Yes or No
For each run, store the response text, every brand named and its order, the cited URLs, and the model version. This lets you recalculate metrics later, audit surprising results, and see which sources the model relied on.
6. Collect a Baseline Before You Change Anything
Collect two to four weeks of data before publishing new content or running a campaign. Without a baseline, you cannot tell whether a change in visibility came from your work or from normal variation.
7. Layer in First-Party Data
Connect Search Console, Bing Webmaster Tools, and your analytics tool so tracked visibility can be compared with real impressions, citations, and AI referral sessions.
Doing all of this by hand quickly becomes impractical. Most teams use a dedicated platform; our comparison of AI search visibility tools covers the main options, and our guide to the best LLM tracking tools explains how they collect answers. For a broader walkthrough of the tracking process, see how to track brand visibility in AI search.
How Should You Report AI Visibility to Stakeholders and Clients?
A good AI visibility report answers three questions in order: are we more or less visible than last period, why, and what are we doing about it. Leadership and clients rarely need every metric. They need the trend, the competitive context, and the next actions.
What to Include in a Monthly AI Visibility Report?
Section | What to show | Why it matters |
|---|---|---|
Headline trend | AI visibility score and mention rate, this month vs last month | One number everyone can follow |
Competitive view | Share of voice against the fixed competitor set | Shows whether gains are real or the whole category moved |
Breakdown | Mention rate by model and by funnel stage | Points to where the gap is |
Sources | Top cited domains for your prompts, yours and others | Shows where to publish or earn coverage |
Outcomes | AI referral sessions and conversions from analytics | Connects visibility to business results |
Actions | What was done last month, what is planned next | Turns the report into a work plan |
Match the Cadence to the Audience
Weekly, for the working team. Prompt-level changes, new competitors appearing, and lost citations.
Monthly, for marketing leadership or clients. Score, share of voice, breakdowns, and actions.
Quarterly, for executives. Share of voice trend, AI referral traffic, and how visibility compares with the plan.
Show Uncertainty Instead of Hiding It
Because AI answers vary, small month-to-month changes can be noise. Report the number of answers behind each metric, and avoid celebrating or explaining a shift of a few points on a small sample. A useful rule is to call a change meaningful only when it holds for two or more reporting periods, or when it appears across several models at once.
For agencies, this also protects the relationship. A client who understands that AI visibility is a rate with a range will trust the trend more than one who was shown a single screenshot.
Turn Findings Into Work
A report is only useful if it changes what the team does next. Visby, for example, groups prompts by funnel stage, highlights prompts where competitors appear and you do not, and turns those gaps into prioritized technical and content GEO tasks, so the “actions” section of a report comes from the same data as the metrics. Teams comparing other platforms that combine measurement with optimization can review these GEO tools for AI visibility tracking.
What Are the Most Common AI Visibility Measurement Mistakes?
Measuring once. A single answer, or one check per week, cannot separate a real change from normal variation. Repeated runs are the minimum requirement for a metric you can report.
Mixing branded and unbranded prompts. Prompts that name your brand will mention you almost every time. Blending them with category prompts inflates overall visibility and hides the gap that matters most: whether AI recommends you to people who do not know you yet.
Changing the prompt set or competitor list mid-stream. Every change breaks the trend line. If you must update prompts, run the old and new sets side by side for a period, and mark the change in reports.
Averaging across models. ChatGPT, Claude, Gemini, and Google AI Overviews draw on different sources and behave differently. The St. Gallen study recommends setting engine-specific baselines rather than one threshold for every AI search product. A single blended number can hide a model where you are almost invisible.
Counting mentions but ignoring sources. Mentions tell you where you stand. Citations and cited domains tell you why. Without source data, you know you are losing but not where the competitor’s advantage comes from.
Comparing scores from different tools. AI visibility scores are vendor-specific. A 40 in one platform and a 40 in another do not mean the same thing, because formulas, models, and collection methods differ.
Measuring without a plan to act. Measurement is the first half of the loop. The second half is optimization, through content, technical fixes, and third-party coverage. When you reach that stage, our comparisons of dedicated AEO software and AI SEO platforms cover the tools built for the work itself.
Frequently Asked Questions About Measuring AI Visibility
What is a good AI visibility score?
There is no universal benchmark for a good AI visibility score, because every tool calculates it differently and categories behave very differently. Judge your score against two things: your own trend over time, and your competitors’ scores on the same prompts in the same tool.
What is share of voice in AI search?
Share of voice in AI search is the percentage of all brand mentions in AI answers that belong to your brand, across a fixed set of prompts and competitors. It is calculated as your mentions divided by total mentions of all tracked brands, multiplied by 100.
How many prompts do you need to measure AI visibility?
Most brands can start with 30 to 100 prompts spread across awareness, consideration, and decision stages. That is a practical starting range rather than a fixed rule. Fewer prompts make results noisy, and many more prompts are hard to act on.
How often should you measure AI visibility?
Run prompts daily or weekly, and report monthly. Frequent runs give stable rates, while monthly reporting smooths out short-term swings and gives content changes time to show an effect.
Can you measure AI visibility for free?
Partly. Google Search Console and Bing Webmaster Tools show free first-party data for Google’s and Microsoft’s AI features. Manual checks in a spreadsheet can work for a handful of prompts, but repeated runs across several models quickly need a dedicated tool.
How is AI visibility different from SEO rankings?
SEO rankings measure where a URL appears in a fairly stable list of results. AI visibility measures how often a brand is named, cited, or recommended in generated answers that change from run to run. That is why AI visibility is reported as rates and shares rather than positions.
Start With a Baseline You Can Trust
Pick your competitors, write a stable prompt set that separates branded and unbranded questions, and collect a few weeks of repeated runs before you report anything. Everything else, from scores to client reports, depends on that baseline being solid.
If you want mention rate, share of voice, and funnel-stage breakdowns calculated for you, along with a prioritized list of GEO tasks built from the gaps, you can start a Visby trial and build your first baseline on the engines you choose from ChatGPT, Claude, Gemini, and Google AI Overviews.
NEXT ARTICLE
