All articles
·
6 min read
Google Tests New AI Performance Report In Merchant Center
Google tests a new Merchant Center report showing product visibility in AI Mode results.

Shopping search is changing shape. People are not just typing two or three keywords anymore, they are asking full questions, comparing products in one prompt, and expecting an answer that already understands context. Google is now giving merchants a way to measure how they show up inside that shift.
A new report called AI Performance Insights is rolling out inside Google Merchant Center. It is currently in a limited pilot for select accounts in the US, with Google planning to expand it to Australia, Canada, India, and New Zealand over the coming months. If you sell through Google Shopping and you have not seen this tab yet, that is expected, access is still rolling out slowly.

Why Does This Report Matter For Merchants?
Until now, merchants had almost no visibility into how their products performed inside AI Mode or AI Overviews. You could see clicks and impressions from traditional Shopping ads and free listings, but the moment a shopper’s query moved into a conversational AI experience, that data disappeared into a black box.
This report opens a small window into that black box. It does not give you clicks. It gives you something closer to a visibility scorecard, how often your brand appears in AI generated answers, how that compares to competitors, and which parts of the shopping journey you are winning or losing.
Where Do You Find The Report Inside Merchant Center?
The path is fairly simple once access is granted:
Log into Google Merchant Center.
Open the Analytics tab on the left side menu.
Click into Products.
Select the AI performance tab at the top of the page.
If the tab is not there, your account has not been included in the pilot yet.

What Does The Report Actually Measure?
Google built the report around four core metrics, and none of them are about clicks or conversions. They are all about visibility.
Your share of voice. This is the percentage of AI impressions your brand captures compared to the total impressions across you and your competitors for related queries. Think of it as your slice of the AI answer pie for a given topic.
Your competitors’ average share. This benchmarks your share of voice against the average share held by the competitor set already defined in your Merchant Center account. It tells you if you are ahead of the pack or falling behind.
Query frequency. This shows how often certain query types, product terms, journey phases, or attributes come up in conversational search. It is essentially a demand signal, telling you what shoppers are actually asking about right now.
Query type. This categorizes the kind of question being asked, searching by category, researching specs, looking for reviews, and so on, independent of where the shopper is in their buying decision.
One limitation worth flagging early: this report only counts conversational queries tied to shopping intent or brand mentions. General informational queries that do not carry purchase intent are excluded entirely.
What Filters Can You Apply To The Data?
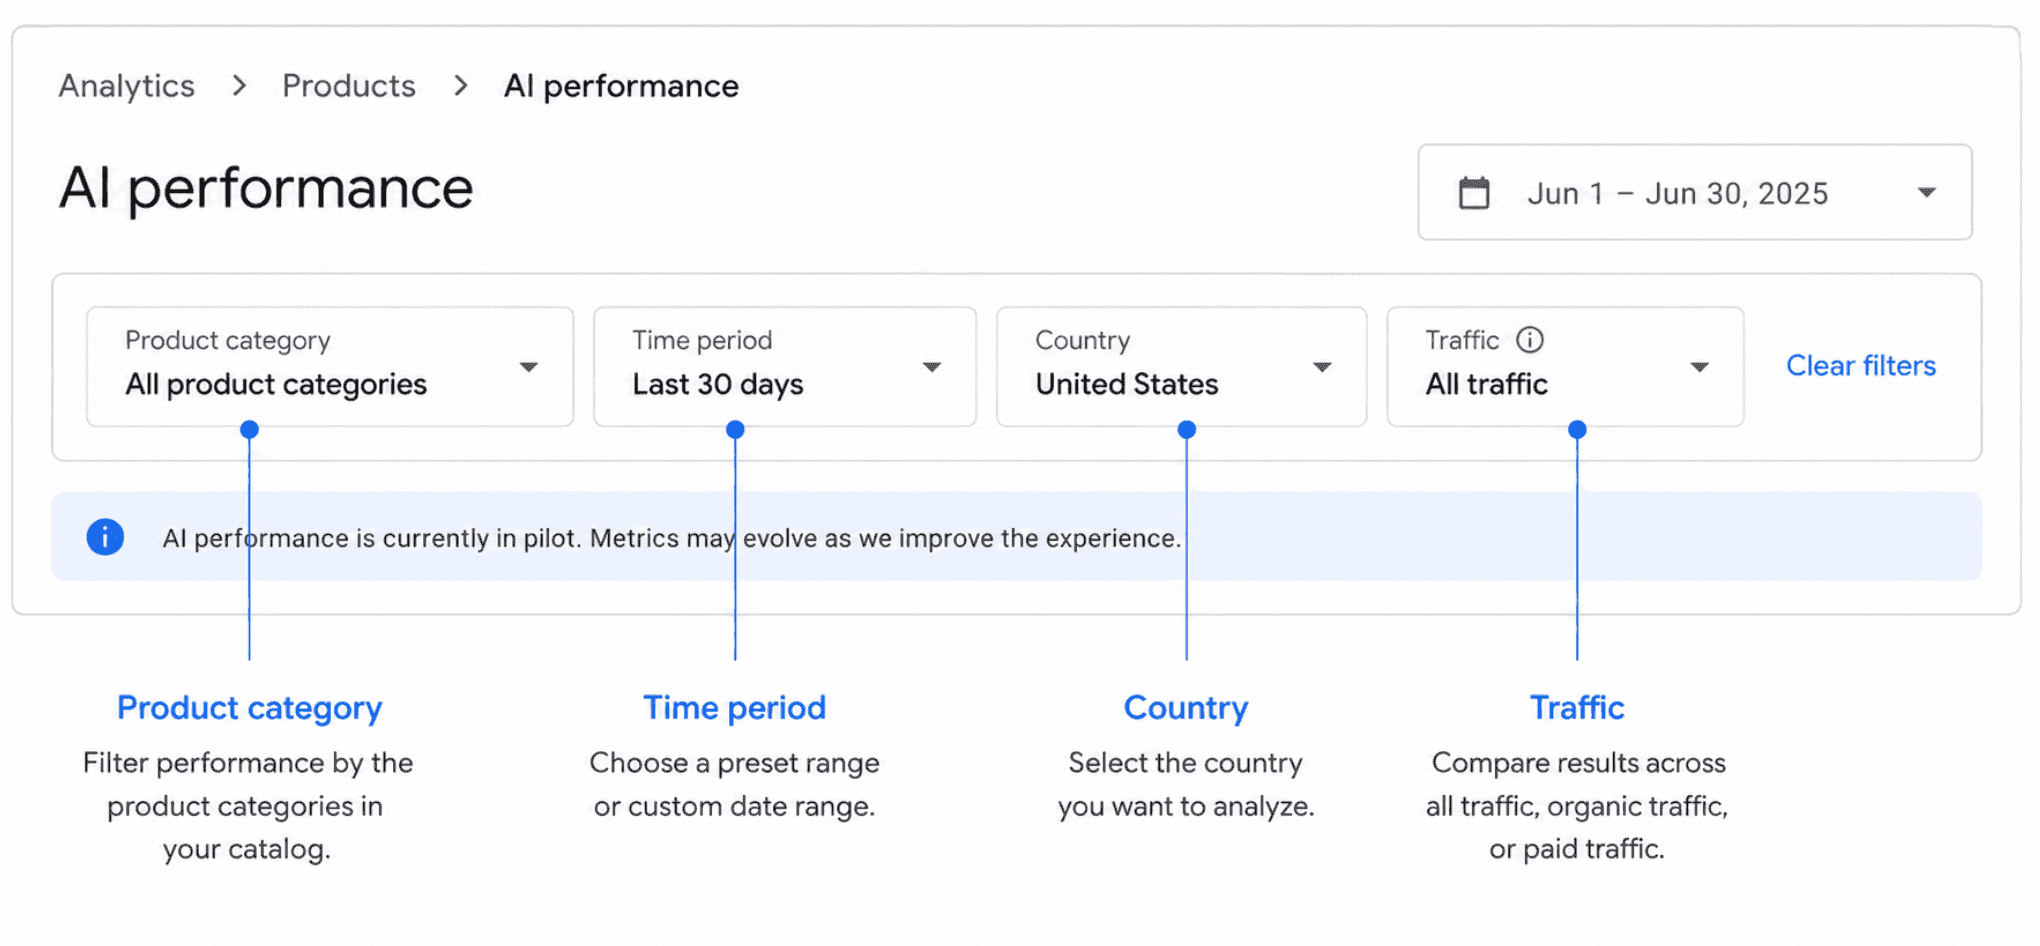
At the top of the dashboard sits a standard filter bar with four options:
Product category, one category at a time, there is no all-categories view.
Time period, limited to whatever range Google makes available.
Countries, restricted to markets where your account is eligible.
Traffic, and this is important, the data only reflects organic AI traffic such as free listings. Paid Shopping ads are not part of this report.
How Does Google Break Down The Shopping Journey?
The report splits conversational queries into three journey phases, and this is arguably the most useful part of the whole dashboard for planning content.
Discovery. Early stage browsing, shoppers exploring general options without a clear favorite yet.
Evaluation. Mid stage comparison, shoppers weighing specs, features, or reading reviews before deciding.
Purchase. Late stage, close to checkout, often price or availability driven.
For each phase, you get a share of voice score against competitors plus deeper breakdowns showing where you are strong and where you are exposed. Google gives a useful example in its own documentation: if you are looking at the discovery phase and “search by product features” queries are trending high, but your share of voice for that query type is low, that is a direct signal you are missing an optimization opportunity.
One caveat Google notes, a single query can occasionally fall into more than one phase if a shopper packs multiple intents into one prompt, like asking for pricing and a comparison at the same time.
What Actionable Recommendations Does The Dashboard Give?
Beyond the scorecards, the report surfaces two optimization sections that are meant to turn insight into action.
Frequently used AI shopping terms. This surfaces the exact functional language shoppers are using in conversational searches, phrases like “maximum cushioning” or “arch support” in a footwear example. Next to each term you will see how many of your products currently match it, how popular the term is, and your share of voice for it. Clicking “View all product terms” opens the full list, which is a genuinely useful place to pull language for your titles and descriptions.
Popular product attributes. This flags structured attributes shoppers care about, size, color, material, and similar fields, that might be missing or incomplete in your product feed. Clicking “View all product attributes” takes you to the full breakdown.
Worth noting, this section only covers structured attributes, so unstructured description text is not evaluated here the same way.
What Should You Do If Data Looks Wrong Or Missing?
Google outlines a few known edge cases:
Why does share of voice show 0? Not enough impressions were recorded to calculate a meaningful percentage.
Why does share of voice show 100 percent? This usually means your account does not have a defined competitor set in Merchant Center, so there is technically nothing to share the voice with.
Can you change your competitor set? No. It is pulled automatically from the competitors already configured in your Merchant Center account, and there is currently no manual override.
Does The Report Include Click Data?
No, and this is worth repeating because it is the question most merchants ask first. Everything in this report is impression based. You get visibility metrics, share of voice, query frequency, journey phase breakdowns, but nothing that tells you whether that visibility actually turned into a click or a sale. For now, AI Performance Insights answers “are we being seen” not “are we being clicked.”
A Quick Take From The Team
We have been tracking Merchant Center’s analytics rollouts closely, and this one stands out because it is the first time Google has given merchants a structured, native way to measure AI search visibility instead of leaving it as guesswork. The lack of click data is a real gap, but treating this as an early signal report rather than a performance report is probably the right mental model for now. Pair it with your existing organic and paid Shopping data rather than expecting it to replace either.
If your account has access to the pilot, it is worth checking the discovery phase term list first. That is where the fastest, lowest effort wins usually sit, since updating a product title or description is far quicker than restructuring your feed’s attributes. Once the report expands past the US pilot, expect competition for these terms to tighten fast, so the merchants who move on this early are the ones who will hold a share of voice lead when everyone else catches up.

