Tüm yazılar
·
6 min read
What is Category Temperature? For Measuring AI Visibility
Category temperature shows how contested a category is in AI search results.

Category temperature is a score that shows how concentrated or contested a product category is inside AI generated answers. A cold category has one brand that shows up in almost every answer. A very hot category has several brands trading places from one answer to the next, with no single brand reliably on top.
The concept comes from Visby, a platform that measures brand visibility across ChatGPT, Gemini, Claude, and other AI engines. It exists because a single AI answer tells you very little on its own. An AI model regenerates its response every time it is asked, so one run is really just one roll of the dice. Category temperature is what you get when you run the same prompt many times and look at the pattern instead of a single result.
Why This Matters for AI Visibility Strategy?
Knowing a category’s temperature changes what a reasonable strategy looks like. In a cold category, a challenger brand is fighting a near-monopoly on the AI’s attention, and the same content or citation work that moves a warm category might barely register. In a hot or very hot category, rank one is genuinely contestable, and consistent, well cited content can shift the odds within a few tracking cycles.
This is also why category temperature is usually discussed alongside other parts of the AI visibility toolkit. If your focus is generative engine optimization more broadly, our roundup of the best GEO tools is a useful place to start comparing platforms.
The Three Metrics Behind Category Temperature
Visby’s methodology builds the temperature score from three underlying metrics, each measured per model, market, and funnel stage.
Mention Stability: the percentage of runs in which a brand appears at all.
Position Variance: how much a brand’s rank shifts from run to run. Low variance means an entrenched position; high variance means the ranking is still up for grabs.
Category Temperature itself: a concentration index (similar in spirit to an HHI score) that shows whether one brand effectively owns the answer or whether several brands are still competing for it.
None of these numbers mean much read in isolation. A brand can have a high mention rate and still lose the top spot consistently, which is exactly the kind of gap category temperature is designed to surface.

Visby’s three underlying metrics and its four-band temperature scale, from Visby’s brand deck.
The Four Temperature Bands
Visby groups categories into four bands based on how the underlying scores behave.
Band | What It Means |
|---|---|
Cold | High consensus. One brand dominates almost every answer, and rankings barely move between runs. |
Warm | Partly settled. A leader usually exists, but a handful of challengers appear often enough to matter. |
Hot | Open to challenge. Several brands have a real shot at the top position, and rankings shift noticeably run to run. |
Very Hot | High volatility. No brand has a reliable hold on the answer, and the mentioned brands themselves can vary widely. |
Category Temperature in Practice: Fuel Retail vs. Insurance
Visby ran the same methodology, the same model, and the same funnel across two categories, with 100 runs per category, as part of its Category Temperature pilot study. The two categories landed in very different places on the scale.
Metric | Fuel Retail | Insurance |
|---|---|---|
Leader’s share of rank one | 95% | 49% |
Concentration index (HHI) | 0.90 | 0.42 |
Distinct brands winning rank one | 3 | 5 |
Distinct brands mentioned overall | 19 | 41+ |
Answers naming no brand at all | 0% | 11% |
Most stable brand’s rank std. dev. | 0.20 | 0.74 |
Individual brand names are omitted; the figures reflect the most stable brand observed in each category.
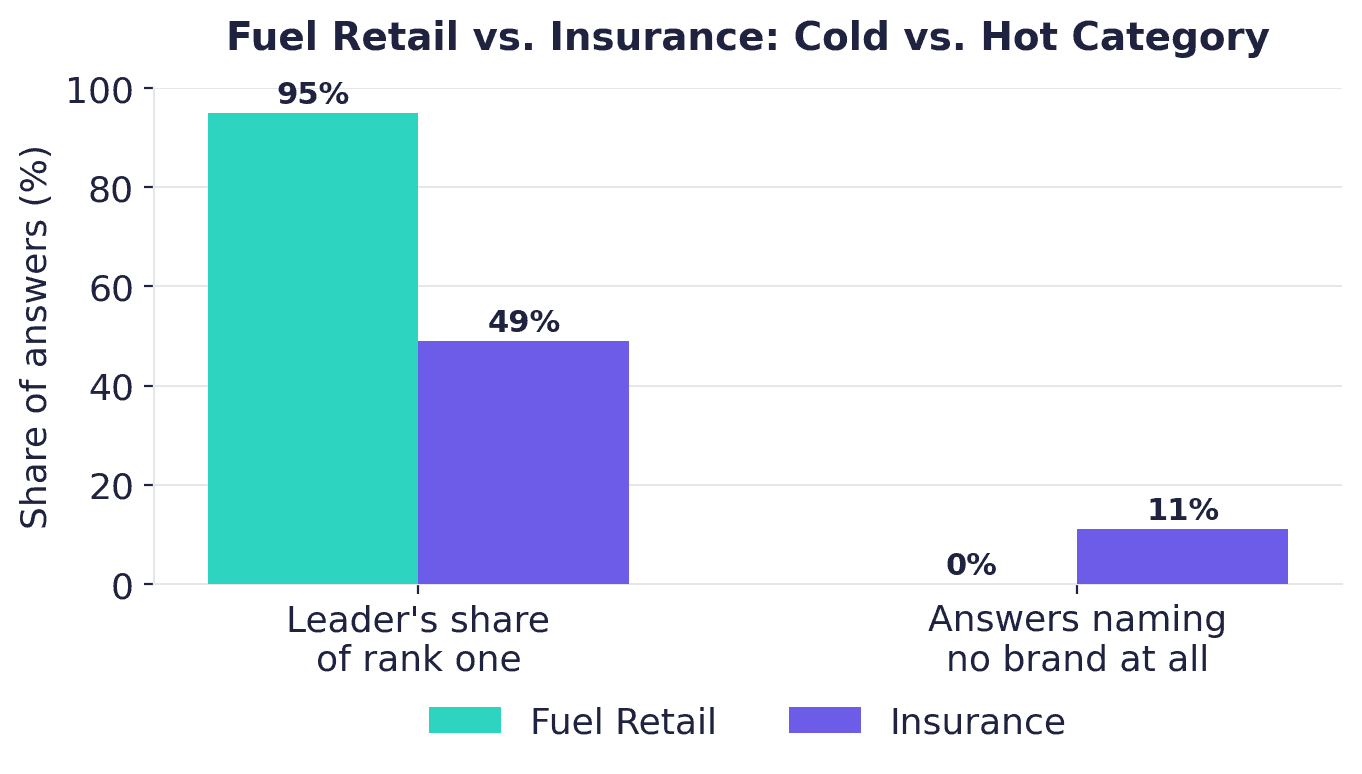
Fuel retail names a brand in every answer and gives one leader nearly all of rank one. Insurance does neither as reliably.
Fuel retail came out cold: one leader wins almost every top spot, and answers reliably name a brand at all. Insurance came out much hotter, with a wider spread of brands mentioned and a meaningfully higher share of answers that name no brand at all.
Mention Rate Is Not the Same as Winning Rank One
Looking at individual brands inside the insurance category shows why the two metrics need to be read together, not separately.
Brand | Mention Rate | Avg. Rank | Rank Std. Dev. |
|---|---|---|---|
Brand A | 79% | 2.46 | 0.76 |
Brand B | 77% | 1.75 | 0.74 |
Brand C | 60% | 3.47 | 0.62 |
Brand D | 57% | 1.35 | 0.98 |
Brand E | 32% | 5.00 | 1.97 |
Brand F | 25% | 5.28 | 0.96 |
Brand names anonymized. The pattern, not the identity of any single company, is the point.
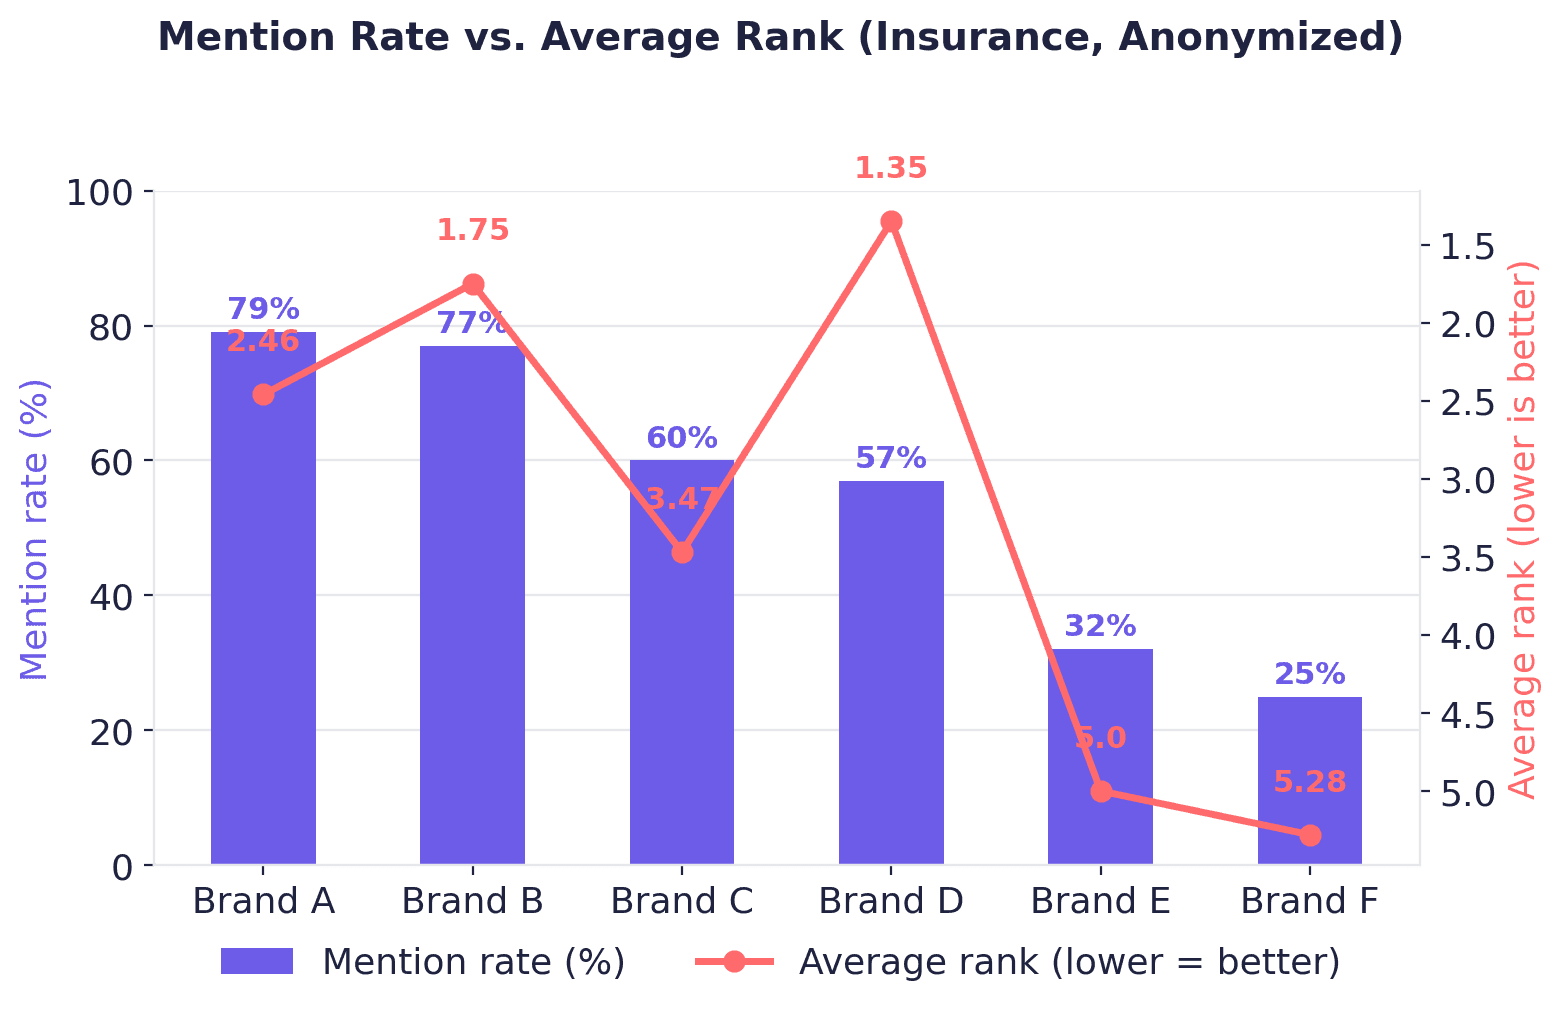
Brand D is mentioned less often than Brand A, but ranks far higher on average when it does appear.
Brand D appears in only 57% of answers, yet when it does appear it is almost always ranked first. Brand A shows up far more often, at 79%, but lands at an average rank of 2.46. A brand chasing visibility in a category like this needs to know which problem it actually has: showing up more often, or ranking higher when it does show up. They call for different fixes.
How Category Temperature Relates to GEO, AEO and AI SEO?
Category temperature sits at the intersection of a few overlapping fields, and the terminology in this space is still settling. Teams focused on generative engine optimization as a whole often start with our comparison of the best GEO tools.
Teams specifically trying to earn a spot in structured answer boxes tend to look at answer engine optimization, covered in our list of the best AEO tools. Teams coming at this from a traditional search background often prefer to start from our roundup of the best AI SEO tools, which frames the work in more familiar SEO terms.
And if the goal is specifically visibility across AI models such as ChatGPT, Gemini, and Claude, our guide to the best AI visibility tools breaks down how different platforms measure it, category temperature included.
How Visby Measures Category Temperature?
Category temperature is one part of the six-step methodology Visby uses to measure AI visibility, which we cover in full in How Brands Are Tracking Their Visibility in AI Search. In short: the same prompt runs many times, each AI model is scored separately, and the citations and source domains behind every answer get tracked over time.
The temperature score and its underlying stability metrics are recalculated as part of that same tracking loop, so a brand can see whether a category is heating up or cooling down over time rather than reading a single snapshot.
Frequently Asked Questions
What is category temperature?
Category temperature is a score that shows how concentrated or contested a product category is inside AI generated answers, ranging from cold (one brand dominates) to very hot (no brand has a reliable hold).
Why does category temperature matter for GEO strategy?
It sets expectations for what a strategy can realistically achieve. Cold categories require dislodging an entrenched leader, while hot categories are more winnable through consistent content and citation work.
How is category temperature calculated?
It is built from a concentration index similar in spirit to an HHI score, calculated from many runs of the same prompt, alongside mention stability and position variance for each brand involved.
Is a hot category good or bad?
Neither by default. A hot category is easier to break into but harder to defend once a brand gets there. A cold category is harder to enter but, for the brand that already owns it, easier to hold.
Which tools measure category temperature?
Category temperature specifically is Visby’s own framework. For a wider view of tools that measure related aspects of AI visibility, see our guides to the best AI visibility tools and the best GEO tools.

